Original article by Daniel Cimring on Coinmonks
Charlie Munger loves to say “invert, always invert” as a way to solve problems. Today I’m going to try and apply this advice to bitcoin investing. Rather than ask when is a good time to buy I will invert and instead ask when is a bad time to buy. If you can identify which are the likely bad times then you will also know which are the likely good times. The idea with inversion is that it’s often easier to think about or find a solution to the inverse case. It’s a technique borrowed from mathematics.
First I’ll need to define what I mean by bad. For the purposes of this article I’ll define bad as any time when you buy and the return over the next 365 days turns out to be negative. So if I buy bitcoin today and one year later the return has been negative then that is bad. Simple enough, losing money after one year is pretty bad. You can define bad in any way you like and repeat this exercise with your own definition.
Using this definition of bad lets create a chart of bitcoin 365 day future returns to see when the bad periods have occured. Using Python this is very easy to do.
# Get some price data from Quandl
bitcoin = quandl.get("BCHAIN/MKPRU")
bitcoin = bitcoin.shift(-1) # data set has daily open, we want daily close
bitcoin = bitcoin.loc['2011-01-01':] # Remove the 0's
bitcoin.columns = ['Last']
# For each day calculate the return if you held for 365 days
bitcoin['RollingRet'] = (bitcoin['Last'].shift(-365) / bitcoin['Last'] - 1) * 100
# Plot a chart
ax = bitcoin['RollingRet'].plot(figsize=(14,10))
ax.set_ylabel("% return over next 365 days")
plt.axhline(y=0, color='r', linestyle='-');
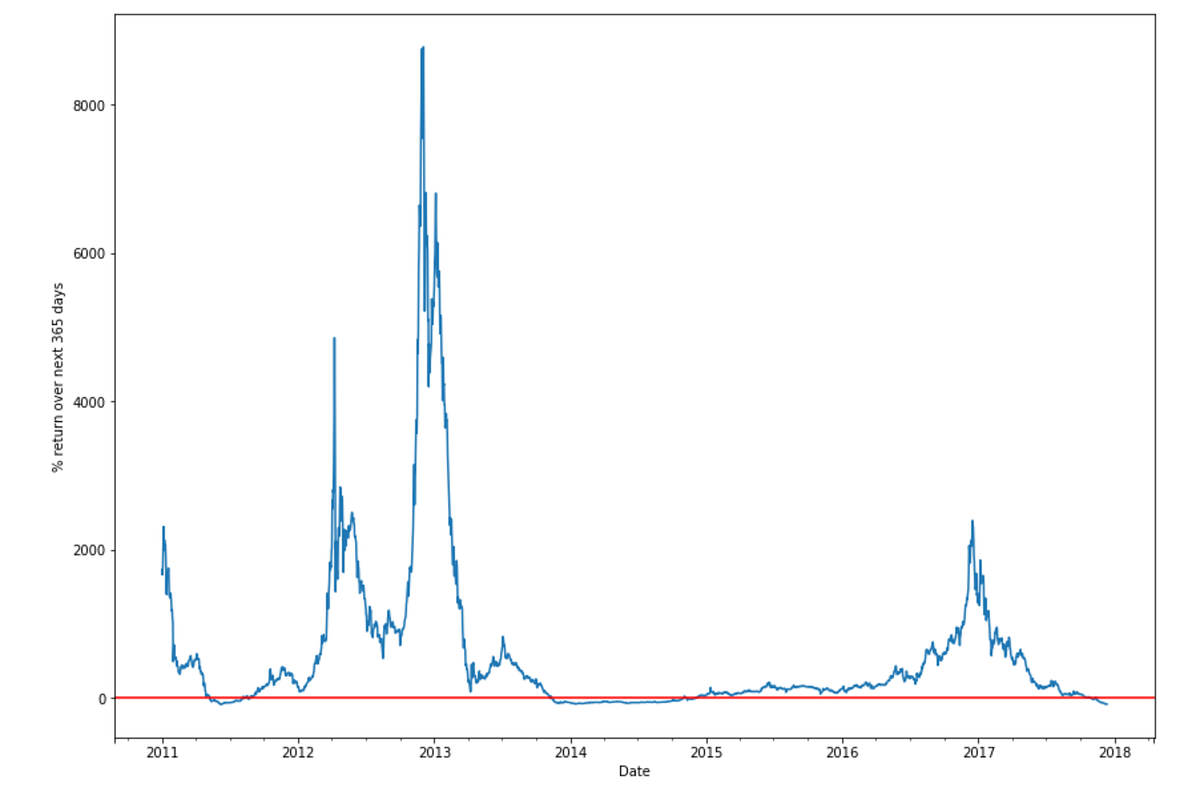
So you can see there was a period in 2011 that was negative, another period at the end of 2013 and for most of 2014, and then a period at the end of 2017. 2018 we don’t yet know since we don’t yet have 365 days of future prices, but I think we can assume a lot of 2018 will be negative too.
Next lets get an actual count of the bad days grouped by year.
# Count days each year where return over next 365 days would have been negative
neg_return = bitcoin[bitcoin['RollingRet'] < 0 ]
neg_return.groupby(neg_return.index.year).count()
#Results
2011 95 days
2012 0 days
2013 50 days
2014 329 days
2015 0 days
2016 0 days
2017 41 days
So although 2011 had the worst drawdown so far in terms of price (a drop of 93%) there were “only” 95 bad investment days. The 2013 and 2014 counts are part of the same bear market so we can add them together for a total of 379 days. 2012, 2015, and 2016 had zero bad days.
Now let’s indentify the exact start and end dates of these bad days and then visualise them on a price chart to see the full context.
# Get the bad day start and end dates for 2011 and see what was happening with price at those times
print neg_return['2011'].index[0]
print neg_return['2011'].index[-1]
# Start 2011-05-09
# End 2011-08-25
The chart below shows the relevant period of time with red showing which are the bad days to have bought bitcoin.
# Plot a chart showing the bad days
fig, ax = plt.subplots(figsize=(14,10))
ax.plot(bitcoin.loc['2011':'2012','Last'].index, bitcoin.loc['2011':'2012','Last'])
ax.plot(bitcoin.loc[neg_return['2011'].index[0]:neg_return['2011'].index[-1]].index, bitcoin.loc[neg_return['2011'].index[0]:neg_return['2011'].index[-1],'Last'], color='#CB4335');
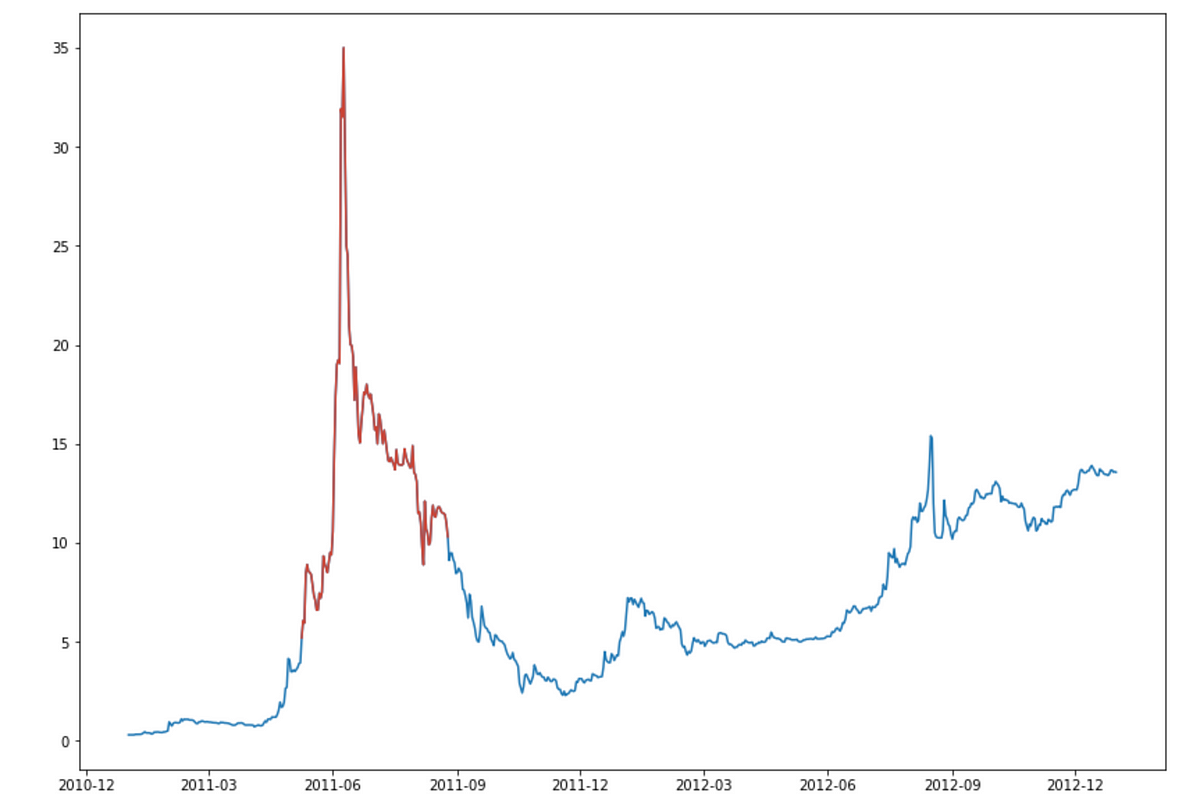
The bad days start near (but not at) the beginning of the vertical run up and then end before the final low is reached. The total decline from the high of around $35 to the price of around $10.30 when the red period ends is 70%. Below is the same chart for the 2013 / 2014 period.
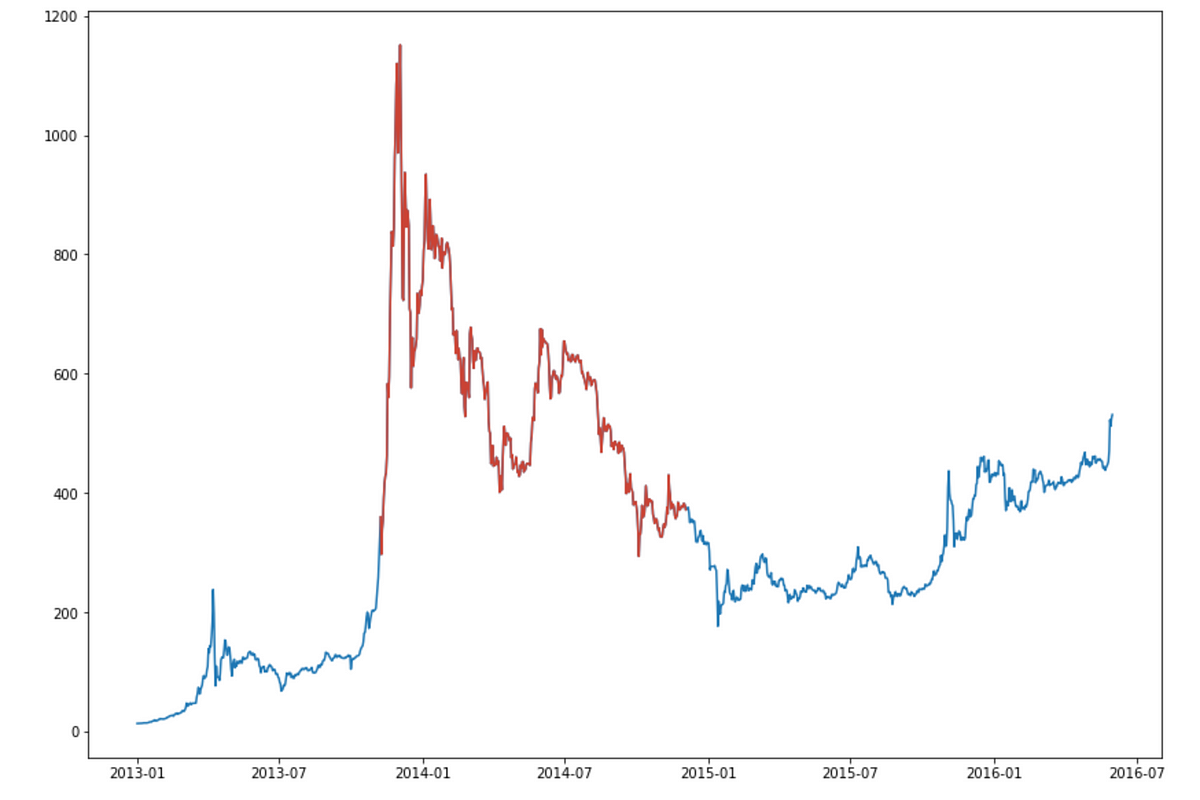
Again the bad days start near (but not at) the beginning of the vertical run up and then end before the final low is reached. The total decline from the high of around $1,151 to the price when the red period ends of around $371 is 68%.
For 2018 lets assume that the entire year up to 13 Nov 2018 will also be bad. The price on 13 Nov was around $6,400 and then started dropping down to the current price of around $3,400. That would mean that we have 316 bad days in 2018 plus 41 in 2017 for a total of 357 days for the current bear market. That’s getting pretty close to the 2013 / 2014 total. Under this assumption this is how the 2017 / 2018 chart would look.
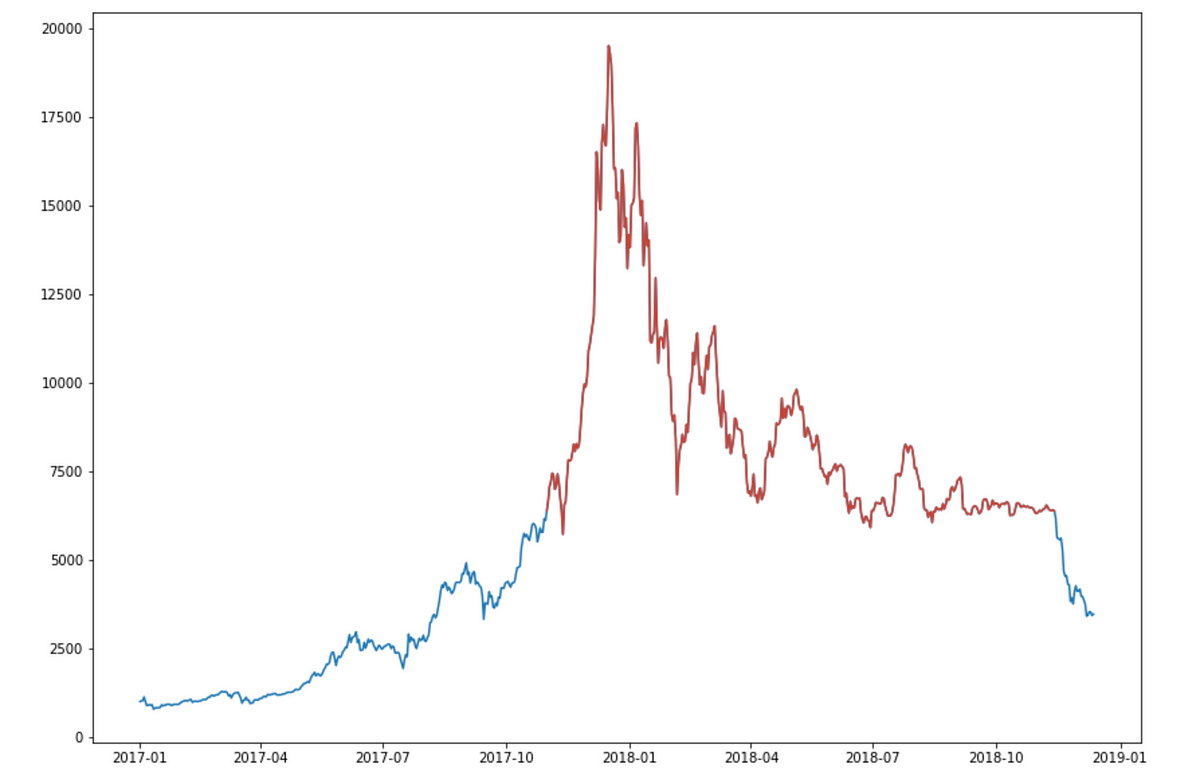
Another way to look at our assumtion is that in both of the previous two bear periods the total decline from the high to the end of the red line was about 70%. If we use $19,498 as the Dec 17 high then a 70% decline would take the price down to $5,849 which means the assumed red line above would end a few days later than shown above.
What does this all mean? To me it means we are at or close to the point where buying bitcoin will not be bad (lead to a loss over the next 365 days). If you have a time horizon of one year or more (more is better) then now is probably not a bad time to be accumulating. Many people reading this will think “what are you totally crazy!”. Remember that many of these same people were clamouring over themselves to invest in bitcoin in late 2017 when the price was a lot higher than now. For a long term holder the time to buy is when you least feel like buying and the time to sell is when you and everyone else are banging down the door to buy.
A Jupyter Notebook with the full Python code is on Github
Please note that nothing in this article should be taken as investment advice. These are my own personal views. If you got this far then you probably already realised that Bitcoin is extremely volatile. Before investing in Bitcoin or anything else please do your own research and make your own decisions.